Banking Profitability Roundup
End of year brings banking industry summaries. Some are very good, such as this one written by Jeff Davis of Mercer Capital (Mercer). In his summary, you’ll find charts and trends for net interest margin (NIM), pre-tax ROA, and fee income for whole institutions, and broken out by size cohorts.
But that is as deep as they could go on public data. Fortunately, through our profitability outsourcing service, we have spread by product, and pre-tax profit as a percent of portfolio balances. So, if we want to know how deposit products are performing relative to each other, and their trend, we have a good idea. We can peel the onion a little farther. If you measure the profitability of your lines of business and products, you can perform this analysis specific to your institution. In any case, follow along for our industry commentary.
Commercial Lending
Mercer’s summary listed strong YTD pre-tax ROA (through September), with banks between $100 million and $1 billion in assets at 1.53%, up 10 basis points from 2018, and 1.67% for $1 billion – $10 billion banks, down 1 basis points from a very good 2018. According to TKG’s profitability peer group database, this strong pre-tax ROA performance was driven by Commercial Real Estate, business interest-bearing checking, and C&I loans (which includes business loans and lines of credit), delivering an average pre-tax year-to-date ROA of 1.92%, 1.30%, and 0.98% respectively.
C&I loans, as classified by our outsourcing clients (so in some cases includes owner-occupied CRE), lagged CRE’s YTD pre-tax ROA. Why the disparity? C&I loans, typically not secured by real estate, tend to be riskier. And since we use co-terminous funds transfer pricing (FTP), we account for the variable rate nature of C&I lending, particularly lines of credit.
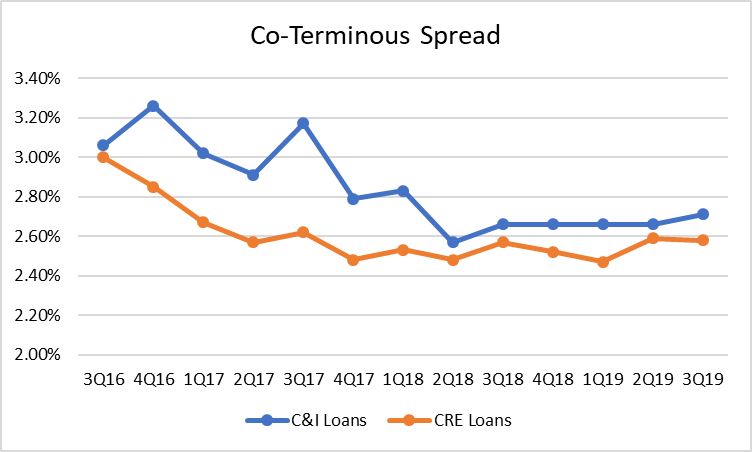 In our experience, the profit disparity relates to yield, average loan balances, and process. As you can see from the accompanying chart, CRE and C&I spreads are not materially different although banks are likely to consider C&I lending as having more credit risk. And C&I loans are generally smaller.
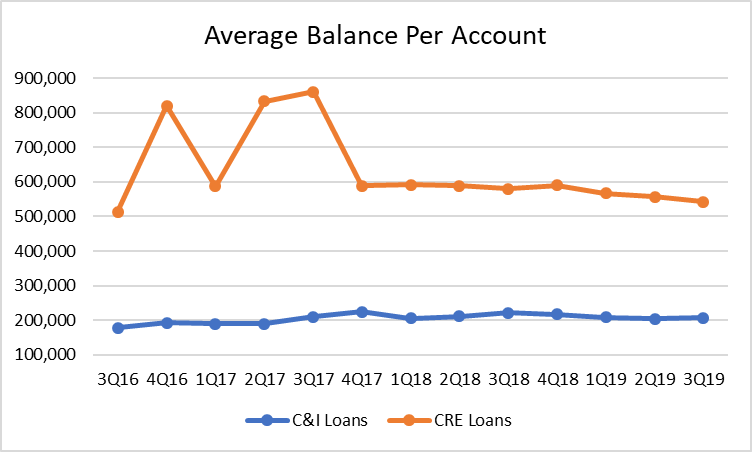
In the third quarter 2019, CRE’s coterminous spread was 2.58%, compared to C&I’s 2.71%. More for sure, but enough to compensate banks for the additional credit risk, organizational resources, and lower revenue per loan? To make the point, see the accompanying chart regarding average balance per loan. While the average CRE loan on a community bank’s books has been consistently over $500,000, C&I loans averaged $200,000. Simple math tells us that 2.58% (CRE Spread) times $500,000 far exceeds 2.71% (C&I Spread) times $200,000. As Jerry Seinfeld said, that’s a “big Matzah ball”.
 If “the market” determines the price of C&I lending, therefore limiting a community bank’s ability to improve NIM through commercial loan yields, then the obvious place to look to improve the profitability of C&I loans is cost. Cost has been most challenging for community financial institutions. In the Mercer report, banks with $100 million to $1 billion in assets had an efficiency ratio of 63.6% in 2006 and 66.1% today. For banks with $1 billion – $10 billion in assets, the same periods were 57.1% and 60.3% respectively. Although NIM was lower between 2006 and today for the smaller banks, it was higher for the $1 billion – $10 billion banks. Industrywide it seems efficiency ratio setbacks are the result of cost.
And our product profitability peer database bears this out as a continuing challenge into 2020. If a C&I loan generates less than half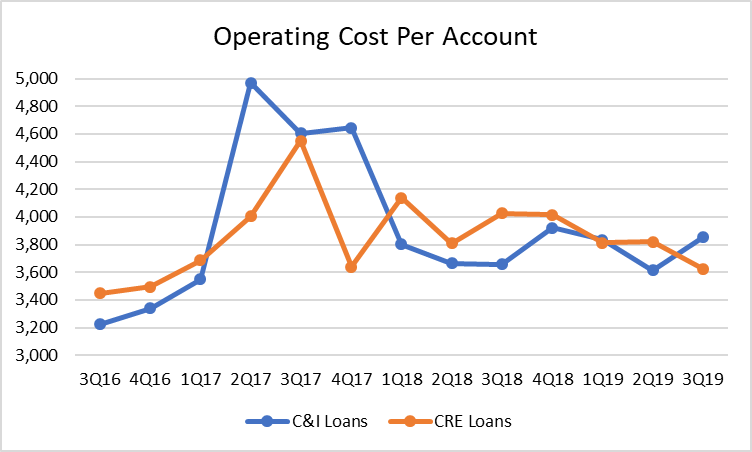 of the coterminous spread revenue of a CRE loan, then cost should be less to make up some profit ground. But this is not so, nor has it been so over the three-year trend period in the accompanying chart. In the third quarter, it took more operating expense to originate and maintain a C&I loan than a CRE loan.
The above chart is fully-absorbed costs. Meaning it includes all organizational costs to originate and maintain commercial loans. It also includes overhead items such as Finance’s preparation of the Call Report, and Marketing’s branding budget. So only looking at the Commercial Loan Department for excess costs would be shortsighted, in our opinion. In fact, we recommend accountability from support functions such as number of loans serviced per FTE in loan servicing, etc. Accountability throughout the bank will be required to fully realize the investment community bromide of “economies of scale”.
Further, to improve either NIM or efficiency, or both, community banks will have to take an analytical approach to C&I lending. Are they reducing credit risk by using the same process to underwrite a $200,000 versus a $500,000 loan? Can processes be automated? Will customers pay higher rates for perceived value such as speed, service, or advice? Could there be automatic yield escalations if customers don’t deliver timely financial statements? This is the type of “hands dirty”, ground level work that community banks must do to improve financial performance in 2020 from the strong performance they delivered in 2019.
Deposits, Deposits, Deposits
The bank C&I lender, after reading the commentary above, should rightly point to deposits as a bridge that connects the profit divide. And our data says it’s true. The YTD average pre-tax ROA of business non-interest checking was 0.76%. Business interest checking, as previously stated, was 1.30% for the same period. The difference in profit performance was not driven by operating cost, as the average annual cost per account for business non-interest and interest-bearing accounts was $618 and $587, respectively. It was driven by average balance per account. Non-interest business checking averaged $32,367 per account; interest bearing was $81,998. Another big Matzah ball.
Unlike commercial loan cost per account, commercial checking cost per account has showed improvement over the three-year trend (see chart). This, combined with the increased coterminous spread due primarily to the Fed increasing interest rates, resulted in improved 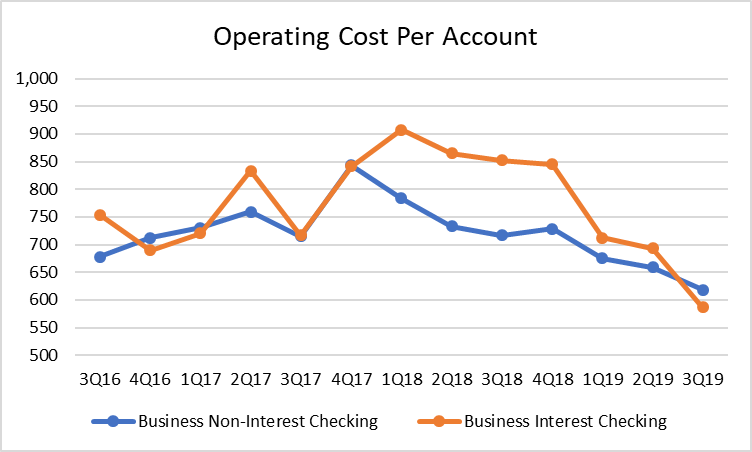 profitability across all deposit categories. Over the long-term (not quarter over quarter), banks should strive to reduce operating costs per account for all product types if they are to realize economies of scale. The business checking chart should be representative of success in other areas.
Aside from the cost issue, and the profitability of commercial checking accounts, there is a more strategic issue here. I mentioned the pre-tax ROA of the commercial account products. I did not mention ROE. There is little consensus among bankers regarding this issue. I’m not talking do we strive for ROA or ROE, although there is plenty of debate there. But what of risk adjusted returns?
This assumes that we assign equity to deposit products. Regulators only measure equity to assets. But do checking accounts have operational, interest rate, liquidity risk? And if so, how do we account for it? Most banks in our profitability outsourcing universe do assign equity allocations to deposits for this very reason. We think it’s appropriate. And that equity is generally over-assigned to assets as a result. Only the riskiest loan categories have 10% in charge offs. Yet, according to risk-weighted capital rules, we assign a dollar for every ten we lend to commercial customers. No, your well-capitalized number should include allocations to deposit products for risks taken, and appropriate capital allocations to loans based on risk.
 In this context, I present to you the following table of ROE’s per product. Because of credit risk and our regulatory scheme of measuring equity to assets, loans require a heckuva lot more “E”, and therefore are challenged to deliver the ROE of deposit products… currently. This was not the case for an extended period from 2009 through 2015 when the Fed Funds Rate hovered at zero and the credit for deposits was at its lowest in our lifetime. This phenomenon led to wide scale branch closures, led by the largest financial institutions, to bolster profits. This made analytical sense since branches generated far less revenue.
And we shouldn’t discount the fine job community banks did at selective branch consolidation and expansion. Average deposits per branch are at their highest ever. Well, I have not measured “ever”, so maybe that statement lacks rigor. But still… Nice job at taking costs out of the deposit gathering portion of the bank and raising the profits and ROE’s of deposit products, even in the continued face of historically low interest rates, increased compliance pressures, and downward pressure on fees.
We believe more work can be done. We still see defensive processes at community banks that are not scalable and that suck organizational resources that were designed to assuage a long-forgotten exam MRA.
In 2020, to improve profits in a highly competitive environment, banks will have to root out these processes and either automate or eliminate them to continually drive down the costs per account, improve earnings, and build a long-term future.
Thank you for reading and have a profitable 2020!
If you would like to measure the spreads, costs, profits and trends of your products and lines of business, we can do that for you. Contact Gregg Wagner at 973-299-0300 x114 or gwagner@kafafianstg.wpenginepowered.com
This newsletter relates to our Performance Measurement service, click here for more information.
To receive our newsletter and other TKG content, subscribe at the bottom of this page.