
Unlocking Data Analytics: The Critical Role of a Profitability Measurement System for 2024 and Beyond
Community banks continue to navigate challenges and opportunities in identifying efficiencies in a post-COVID environment, managing the increasing impact of AI on bank products and services, adapting to a continually evolving regulatory landscape, and addressing margin compression influenced by fiscal and monetary policy. Implementing a bank profitability system that measures branch, line of business and product-level profitability is crucial for navigating this complex environment. This system should incorporate comprehensive cost allocation methodologies, integrate funds transfer pricing at the individual account level, and analyze performance trends over multiple quarters.
The Kafafian Group has been providing this service on an outsourced basis to hundreds of banks and credit unions for over twenty years. Whether you are considering implementing your own solution, exploring the purchase of data analytic software, or considering an outsourced partner like TKG, this article is intended to share insights and explore the importance, process, and benefits of profitability measurement to help your bank leverage data to maximize profitability.
Community Banking Environment Trends as We Look to the Second Half of 2024
1. Post-COVID Recovery:
● In 2020, the community banking industry was forced to take massive leaps forward into its ability and desire to adopt critically needed technology to serve the needs of its customers. The PPP lending crunch pushed bank leadership into the uncertain and uncomfortable (but much-needed) realm of e-signatures, online account opening, and cloud-based bank partnerships. The lingering effects post-COVID have since reshaped customer behaviors and banking operations. Banks must adapt to these changes by understanding profitability at a granular level, to measure and allocate expenses, and thoughtfully build and change critical elements of infrastructure.
2. Higher-for-Longer Rate Environment:
● With interest rates expected to remain high for an extended period, banks face continued spread compression at a faster pace than NIM compression. TKG anticipates a few more quarters of increasing cost of funds as banks continue to compete for liquidity, however, that pace has slowed and with the anticipation of lower Fed Funds, may soon reverse by year’s end. Over the past twenty-four months, most banks have had to fund recent growth with high-cost CDs and borrowings. We are all aware that the pace of change in the cost of funds has been massive, painful, and unprecedented, however, the unintended consequence of the broad-based shortening of the duration of the liability side of the balance sheet has magnified the decline in profitability of many community financial institutions. While most institutions manage to the Net Interest Margin (NIM), we believe that understanding and managing Net Interest Spread tells a more accurate tale of profitability. The chart below shows the recent deviation in spread vs. net interest margin since CD gathering and Short Term Borrowings have been the primary source of funding new growth in recent quarters.
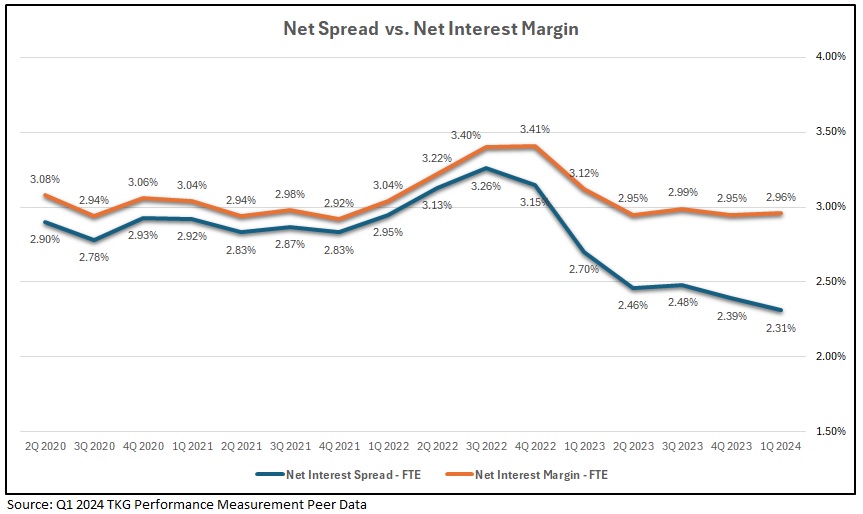
● Accurate profitability measurement helps banks manage these pressures by bringing accountability for spread management to the product and line of business level, identifying cost-effective operations, expensive or inefficient products, high-performing branches, problematic product mix, and high-spread products on both sides of the balance sheet. Bottom line – helping a financial institution identify opportunities to reduce unnecessary expenses, enhance overall profitability and operational efficiency.
Source: TKG Peer Data – Q1 2024
3. Declining Average Balances in Deposit Accounts:
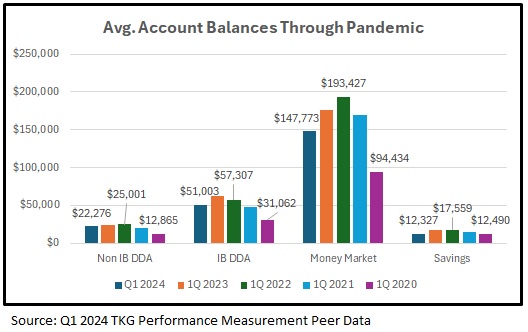
● There is a clear trend in community institutions of declining balances in all DDA, Savings, and Money Market account categories in both consumer and business accounts. The era of free money is over. Inflation has driven average deposit balances, in many cases, below pre-pandemic levels and institutions have turned to high-cost time deposits to meet bank funding needs. This has had a dual negative impact, increasing the cost of funds, and dramatically shortening the duration of the liability side of the balance sheet. The fix for this is aggressive growth of net new depositor relationships. A detailed profitability system helps banks identify and address branch and product trends. This trend data can be used to reward those with positive deposit spread trends, and build product suites or bundles to optimize the product offering strategies needed to drive growth.
4. Regulatory Attention on Detailed Profitability Metrics
● In addition to their traditional focus on liquidity, credit quality, capital levels, and BSA/AML risk mitigation, profitability data review is now on the table. What was once considered “nice to have” information is quickly becoming “must have” data. We are hearing whispers that in the most recent exam cycle, regulators are now asking banks to provide comprehensive profitability analyses, encompassing all levels of operations. This could be the beginning of a major regulatory shift that emphasizes the importance of having robust profitability systems that can deliver precise, actionable insights.
The Method
The Elements of Measuring Branch and Product-Level Profitability
1. Comprehensive Cost Analysis:
● A full cost allocation methodology where all direct, indirect, and overhead costs are assigned to all profit centers and products, provides an accurate representation of the cost to originate and cost to maintain every product in your portfolio. Having this level of detail leads to more accurate and useful profitability analysis. But this step is also the most difficult and time-intensive part of the setting up of any profitability system and if done incorrectly is the #1 reason these systems fail (or fail to pass through the Finance Department). A challenging but critical component to successful execution is to ensure the business line leaders actively participate in creating the model and are the champions of the buy-in of the relevance and usefulness of the model’s outcomes. (At TKG, we execute and implement the entire cost allocation project for our clients, working closely with your team to remove this critical burden from the CFO and finance team and educating business line leaders on the value of this information to generate business line buy-in). Once established, this methodology identifies all the non-interest expenses used by each product at the Direct, Indirect, and Overhead levels, ensuring no expenses are left unallocated.
2. Coterminous Funds Transfer Pricing:
● This is a fancy way to say that the bank should match its ALCO model’s duration of each product with the FHLB yield curve’s (or some other preferred curve) rate at that duration (or a blended rate for non-maturity products) at the time that product is booked on the system. This approach provides a cost of funds to assets and a credit for funds on liabilities and the difference between the two is the spread assigned to that product. This methodology identifies the actual revenue each account contributes to the institution and ties it to the rate environment in which it was originated.
3. Performance Trends Over Time:
● The model should analyze profitability over multiple quarters (at a minimum of five) to help identify trends and patterns and to understand the impact of strategic initiatives and market conditions on profitability. An emphasis on quarters and years, rather than days and months, enables leadership to focus on key, high-level execution in alignment with strategic planning.
4. Team Sell-in / Buy-In:
● Detailed profitability data will empower bank executives to make informed strategic decisions, enabling them to allocate resources effectively and scale successful initiatives. Reviewing this data as a team on a quarterly basis gives every key employee the opportunity to gauge business unit performance and make necessary changes as needed. Additionally, since all key team members participated in the cost allocation study, they should already have some skin in the game.
5. Regular Reporting:
● Reports should help drive understanding of which branches and products are performing well, allowing banks to direct investments and marketing efforts where they will generate the most significant returns.
● Use regular reporting to benchmark performance against peers to help banks identify best practices and maintain a competitive edge in the market.
6. Alignment with Strategic Planning:
● Strategic Planning efforts often rely on budgets and financial projections based on desired high-level outcomes like ROA, ROE, Efficiency Ratio, and Asset growth. Linking detailed financial performance with strategic goals ensures efforts are directed toward achieving long-term success in the areas that will move the needle. Without knowing what is driving profitability, how can you know where to invest time, effort, and resources?
Conclusion
In a dynamic and continually challenging community banking environment, implementing a bank profitability system that measures branch, line of business and product-level profitability is not just beneficial but essential. By adopting a comprehensive cost allocation methodology and analyzing performance trends over multiple quarters, financial institutions can effectively navigate the complexities of the post-COVID economy, changing regulatory landscape, higher-for-longer interest rates, and evolving customer behaviors. Accountability at the branch, lender, and product level serves as the invisible hand to better spreads and better net interest margins as those at the relationship level are empowered to make pricing decisions that benefit bank and customer.
For deeper insights into optimizing your institution’s performance and profitability, we invite you to contact Benjamin Crowley at The Kafafian Group.
Schedule a personalized demo of our performance measurement system today to see how we can empower your organization for future success.
Click here to view printer-friendly version
This TKG Perspective relates to our Performance Measurement service, click here for more information.
To receive our TKG Perspective and other TKG insights, subscribe at the bottom of this page.