
Are Your Management Reports Just An Illusion?
Many financial institutions produce management reports using data only from their general ledger systems. An example is producing branch profitability reports limited to data from the branch’s cost center. Limiting the information within your management reports to only general ledger data may be producing reports that are just an ILLUSION!

As noted by this famous painting by Salvador Dali, what you first see may just be an illusion. At first you may see an elderly couple gazing into each other’s eyes. Take a closer look and you will see a man playing a guitar against a wall within the man’s face and a woman holding a basket on her head within the woman’s face. The same is true if you are only using general ledger data to produce management reports, you may not be seeing a true picture of your financial results. The addition of “Performance Measurement” data helps to transform your management reports into a true picture of performance!
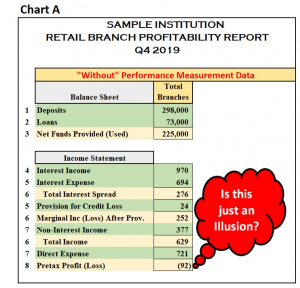
Chart A is an example of how a branch network’s income statement is only an illusion “without” using Performance Measurement data.
The chart shows an income statement for a branch network using only information from the institution’s total branch cost center, or on a direct cost basis. The results show that their branches lost $92,000 during the 4th quarter of 2019. Calculating the profit on a direct cost basis does not tell the true profitability story of the branch network and basing decisions on this information may lead to unintended results.
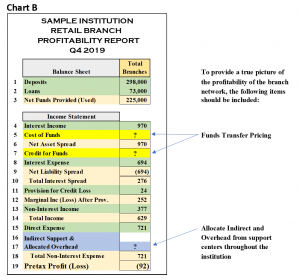
Transfer Pricing
Without transfer pricing, deposits would only have interest expense and loans would only have interest income. Transfer pricing provides a “credit to deposited funds” and “cost of funds provides a charge for loans.” Transfer pricing is typically tied to the “FHLB Fixed Rate Advance Curve,” which eliminates the influence of other decisions not under the control of the management team members responsible for each product.
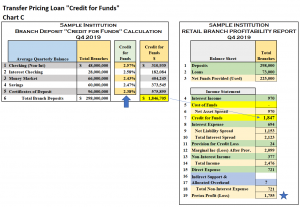
• The “credit for funds” is based upon the average duration of branch deposits. The longer the duration of a deposit product, the longer the credit is extended on the FHLB Fixed-Rate Advance curve which calculates the credit for funds (a core deposit may have an average life of 4 to 7 years, a CD’s transfer pricing is based upon its maturity term).
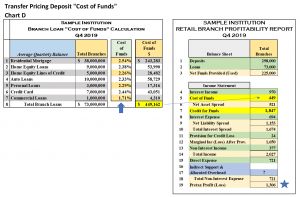
• The “cost of funds” for a loan is based upon its actual maturity and interest rate characteristics. The cost of funds for a 30-year mortgage would be based upon the FHLB Fixed-Rate Advance curve for the term of its discounted cash flow (example: 7 years) and a floating loan rate cost of funds rate may be based upon a 90-day borrowing.
Charts C & D show a sample of the “credit for funds” and “cost of funds” for the sample branch network. As you will see, these two data points significantly change the profitability picture of the branch network.
Indirect Support & Allocated Overhead Expense Allocations
The last piece of data we are missing is an allocation for the Indirect Support and the Allocated Overhead expenses associated with a branch. Indirect Support expenses include services provided to the branches from support cost centers (deposit ops, compliance, IT, etc.) and Allocated Overhead expenses are services provided by administrative cost centers (finance, executive management, etc.). Through PEER data from our TKG’s outsourced Performance Measurement services, we have determined the median cost of indirect and overhead per branch is 1.01% of total branch deposits.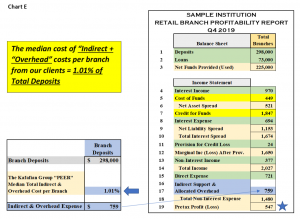
Adding transfer pricing and cost allocations provides a true picture of the profitability of branches! The branch profitability after adding the performance measurement data shows a profit of $547,000, compared to a loss of $92,000 without it. Which report do you want to use as the basis for your decision?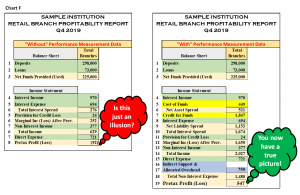
TKG’s Performance Measurement service is designed to provide institutions with profitability information for organizational branches, lending, wealth management, etc. as well as for the products offered. Our clients also use data from these profitability systems to feed customer level data into their MCIF and CRM systems. Over the years we have provided this service to hundreds of institutions, so they can foster an accountability culture and improve their bottom-line results. One of the most valuable components of our service is compiling PEER information that our clients can use to measure against their own performance.
Are you interested in learning more about how institutions can utilize performance measurement information to make more informed decisions to enhance the profitability of your organization and products? If so, please contact me at gwagner@kafafianstg.wpenginepowered.com or call me at 973.299.0300 ext. 114. For institutions under $500 million in assets, TKG recently introduced our “Performance Insight” service which is an affordable profitability measurement system designed specifically for smaller financial institutions.
Click here to view printer-friendly version.
This newsletter relates to our Performance Measurement service, click here for more information.
To receive our newsletter and other TKG content, subscribe at the bottom of this page.