How Will Higher Interest Rates Impact Loan & Deposit Product Profitability?
By:
Gregg J. Wagner
We have already started to see interest rates trending upwards in 2022, but how will these higher rates impact the profitability of your loan and deposit products? Will you have the ability to increase loan rates in step with Federal Funds rate increases and how much of the increase in Federal Funds rates will be passed on to your depositors? Let’s take a look back at the last few Federal Funds rate cycles and see how our PEER institutions responded to them using the net spreads of commercial real estate loans and money market accounts during these cycles.
Through our Performance Measurement service, we provide institutions with product profitability reports that include the “net spread” for each loan product. A “cost of funds” (COF) for loans is calculated to provide a funding cost and a net loan spread. The COF is based on the actual maturity and interest rate characteristics of each loan. We use the FHLB Fixed-Rate Advance curve to calculate the COF.
As we have noted previously and it should not be a surprise to any of our readers, commercial real estate (CRE) loans are the most profitable product for community financial institutions. During Q4 2021, our PEER group CRE product pretax (w/o LLP) ROA was 2.18% which ranked it as the #1 most profitable product. With an annualized average profit per loan of $15,050 and a history of carrying the profit performance of the bank, institutions should be concerned about the impact higher interest rates will have on CRE.
Below are the changes in the net spread of CRE loans during a period that spans prior to the Great Recession through Q4 2021 (Chart A). Note how the pattern of changes in the net spread of CRE loans moves opposite to the changes in the Fed Funds rate. The impact of the Fed lowering the Fed Funds rate 500 basis points from Q4 2006 to Q4 2008 allowed institutions to increase their net spread on CRE loans through Q4 2014 by 100 basis points (Chart B).
The loans originated during this period had a higher net interest spread than the legacy loans within an institution’s CRE portfolio. While the funding costs were lowered during this period, institutions did not have to lower their pricing at the same pace. Once the Fed began to increase rates in 2014, the CRE net spreads decreased since institutions could not pass on the 225-basis point increase to their customers (Chart C).
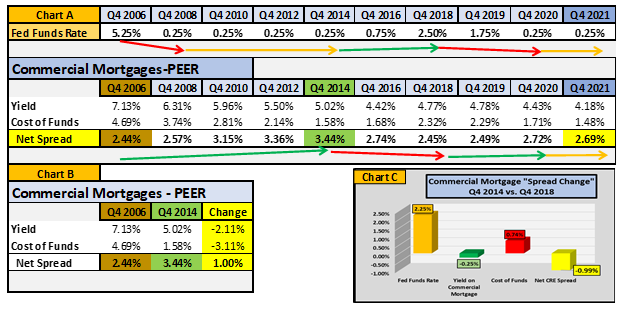 The Fed has already begun to increase rates, so the question is how high will they go? If the Fed raises rates 100 basis points during 2022, will you have the pricing power to increase CRE loan rates by 100 basis points? History says no. With institutions trying to use up their excess liquidity and the competition for loans increasing, the opportunity to match the increase in Fed Funds rates with higher CRE rates may be difficult and the overall profitability of an institution’s most profitable product will likely trend down.
While the impact of an increase in Fed Fund rates will likely negatively impact loan spreads, deposit product spreads should increase. In a rising interest rate environment, the value of deposits increases since institutions do not have the pressure to increase their rates at the same level as the Fed Funds rate increases. As interest rates decline, the opposite is true. While institutions lowered their deposit interest rates when the Fed Funds rate was lowered to 25 basis points, they could not lower them below 0.00%. The value of core deposits cannot be overstated. Even though core deposits may not be as profitable due to the current interest rate environment, they are the life blood of any financial institution and drive institutional value.
For our reporting, we calculate a “credit for funds” (CFF) for deposits to provide interest income and a net deposit spread. The CFF is based on the average life of an institution’s deposit products. Since the average life of a core deposit is higher than a 1-year CD, it has a higher CFF and is thus more valuable. We use the FHLB Fixed-Rate Advance curve to calculate the CFF.
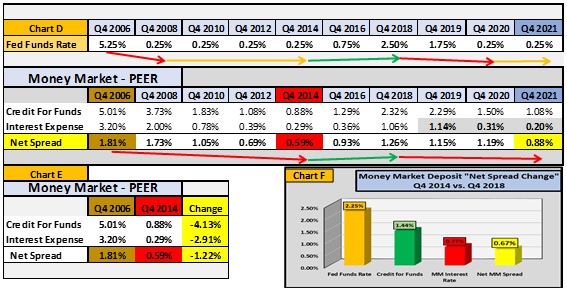
Below are the changes in the net spread of money market accounts from Q4 2006 through Q4 2021 (Chart D). Note how the spread on money market accounts corresponds with the changes in the Fed Funds rates. The impact of the Fed lowering the Fed Funds rate 500 basis points from Q4 2006 to Q4 2008 lowered the spread on money market account through Q4 2014 by 122 basis points (Chart E).
When the Fed last increased interest rates from 2014 through 2018, the average spread on the money market product improved 67 basis points (Chart F). The CFF increased 144 basis points and the rate paid increased 77 basis points. With the excess liquidity institutions are currently experiencing (consumers have accumulated nearly $3.0 trillion in excess savings from March 2020 through November 2021), the beta of deposit rate increases is expected to be lower than experienced during the Fed’s prior tightening.
The higher interest rate environment we are already experiencing will present challenges for institutions in 2022. The excess liquidity most institutions have on their balance sheets should provide an opportunity to maintain low funding rates and thus provide an opportunity to increase the profitability of core deposits and therefore branches especially if those branches are core funded. If institutions can be disciplined in the pricing of new loans, they should have an opportunity to increase their Net Interest Margin which will drive higher overall earnings.
Our Performance Measurement service is designed to provide institutions with profitability information for their organizational profit centers and for the products they offer. Our clients also use data from these profitability systems to feed customer level data into their MCIF and CRM systems. Over the years we have provided this service to hundreds of institutions, so they can foster an accountability culture and improve their bottom line results. One of the most valuable components of our service is compiling PEER information our clients can use to measure against their own performance.
Are you interested in learning more about how your institution can utilize performance measurement information to make more informed decisions to enhance the profitability of your organization and products? If so, please contact me at gwagner@kafafiangroup.com or give me a call at 973.299.0300 ext. 114.
Click here to view printer-friendly version.
This newsletter relates to our Performance Measurement service, click here for more information.
To receive our newsletter and other TKG content, subscribe at the bottom of this page.