
Mortgage Lenders Experienced Record Profits – Could They Have Done Better?
During the pandemic, TKG worked with several clients on process improvement engagements where the scope of the project was focused on residential lending. Like many financial institutions who originate residential mortgage loans, our clients experienced unprecedented levels of production volumes over the past 18 months due to low interest rates and increased home sales. These originations are at the highest levels we have seen since the 2008 financial crisis. According to the Mortgage Bankers Association, mortgage originations increased 70 percent in 2020 to $3.8 trillion from $2.2 trillion in 2019.
With the increased volume, our clients have experienced record levels of fee income and an overall improvement in the profitability of their mortgage divisions. However, certain financial institutions began to question if their operating processes were efficient enough to handle production volumes, and if they were effectively utilizing technology. They also wanted to know if it was possible to achieve higher levels of profitability.
Many institutions have been challenged in recruiting talent in this competitive environment causing them to question if their commission structure is aligned with other banks. To uncover the facts, TKG conducted a survey amongst a number of financial institutions with compatible mortgage models to learn more about commission structures. This can obviously be a sensitive topic.
Instead of inundating bankers with countless questions requiring time and research to complete, we limited the survey to four questions. We asked the participants for their production volume in number of loans originated, dollar amounts, the average commission rate, incentives paid to back-office mortgage employees, and their approach to marketing. We experienced an overwhelming interest in participating which we attributed to two things: 1) there was an interest in gaining insight into the practices of other banks and competitors, and 2) the limited questions did not require significant research. Participants received a summary of the survey responses in the form of benchmarks to maintain confidentiality of respondents. Based upon the positive feedback, we expect to be doing more of these quick-hit surveys not only for residential lending but other topics of interest. If you would like to be included in future TKG surveys, please be sure to let us know.
For the commission structure survey, eight financial institutions located in the Mid-Atlantic Region participated. The median asset size of the financial institutions was $2 billion and 75% were publicly held companies. In 2020, the average volume of loans closed was $477 million and the average number of loans closed was 1,407. The average loan size was $296 thousand. The results of the survey showed that the commission structures for originators varied and ranged from a fixed salary and no commission to commission only. As shown below, the average commission rate paid to originators was 80 bps and the median was 75 bps.
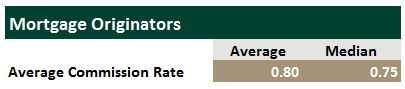
Five of the eight respondents indicated their originators were commission based only with a median commission rate of 85 bps. Some had a combination of draw plus commission, with an average annual draw of $25 thousand along with a commission rate of 75 bps. Institutions with the highest production volumes appeared to have a commission structure aligned with larger bank subsidiaries and mortgage companies.
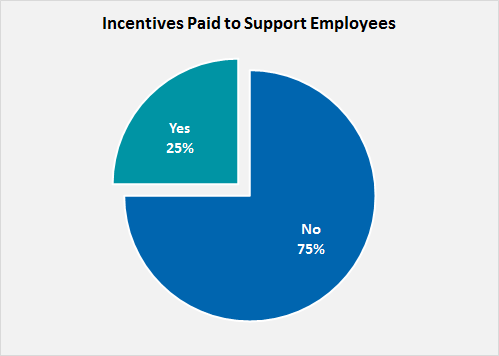
As it relates to incentives paid to back-office mortgage employees, only 25% of survey participants paid per unit incentives to processors, underwriters, and closers. In general, it is common for large bank mortgage subsidiaries to provide commissions to their operations teams, but they are also the same companies who tend to lay-off employees when volumes decline. In our experience, community banks rarely provide commissions to back-office operational personnel because they are less likely to displace employees when volumes decline, especially high performing employees. While staffing continues to be a challenge for many, financial institutions are looking internally for the resources needed to assist with volume.
Some executives will point to their commission structure as the “smoking gun” for why their revenues are not higher. This may play a role in why profits are lower than expected but it is not the only reason.
When TKG performs process improvement engagements, we do not base our recommendations solely or primarily on benchmarking. It is used as an indicator on where there may be opportunities for improvement and where further analysis is needed. Often, we uncover general themes. For example, we may discover a client’s gain on loan sales are lower than our benchmark. As we dig deeper, we might find that an institution’s fee income is lower when compared to TKG profitability measurement clients with similar production volumes requiring even further analysis in our attempt to uncover the root cause. There are also other examples where our analysis showed that a delay in closing loans resulted in lower than projected premiums from investors. Not only are financial institutions missing revenue opportunities, but a bad experience can impact the customer relationship and the institution’s reputation with realtors and investors.
The utilization of technology also plays an integral role in the performance of a mortgage division. It is not uncommon for TKG to uncover that clients are not fully utilizing the workflow and services within their systems. Do you have the necessary technology including client facing tools to manage the pace of originations or due to inefficiencies did it feel like you were changing a tire on your car as you were racing down the highway? Inefficient processes and workflows combined with the ineffective utilization of technology requires greater resources which also impacts profitability.
It is clear loan volumes are one of the primary drivers of higher profits and why the related fee income earned is at its highest levels. However, could it be higher? Do you know how you compare to your peers and the mortgage industry in fee income and secondary market returns? When was the last time (if ever), you measured the profit of your mortgage loans on a per loan basis? TKG has developed a model that can do this for our clients. Do you know the profile of the loans you close, FICO, LTV, DTI and how they compare to the industry? What about the turnaround time from application to closing? All the above can have an impact on the performance of your mortgage division.
What lessons have you learned over the past year or so to know where improvements are needed or can be made? Have you performed an analysis to learn where there are opportunities to improve profitability? At the time of this writing, mortgage volumes continue to remain high, but as they always have in the past, they will eventually decline. Now is the time to prepare your mortgage lending strategy for the future.
Click here to view printer-friendly version.
This newsletter relates to our Profit and Process Improvement service, click here for more information.
To receive our newsletter and other TKG content, subscribe at the bottom of this page.