Update: How has the Fed’s battle against inflation impacted bank product profitability?
At the end of the 3rd quarter of 2022, we provided analysis of how banks were impacted by the Fed increasing the Fed Funds rate from 25 basis points to 3.25% from Q1 2022 through Q3 2022. The Fed continued to increase rates through Q2 2023 and it looks like they are poised to increase rates one or two more times through the end of year.
Community Banks certainly benefited by these rate increases as noted by their Net Interest Margin increasing from 3.21% in Q4 2021 to 3.71% in Q4 2022, per the FDIC Quarterly Banking Community Bank Profile report. This increase was due to the Yield on Earning Assets increasing 105 basis points while the cost of funding these earning assets only increased 55 basis points. This positive trend ended in Q1 2023 when the Net Interest Margin for Community Banks contracted to 3.49%, primarily due to a 40 basis point increase in the cost of funding. Let’s take a look at how these rate increases by the Fed have impacted the profitability of loan and deposit products.
Through our Performance Measurement service, we provide institutions with product profitability reports that include the “net spread” for each loan product. A “cost of funds” (COF) for loans is calculated to provide a funding cost and a net loan spread. The COF is based on the actual maturity and interest rate characteristics of each loan. We use the FHLB Fixed-Rate Advance curve to calculate the COF.
Let’s first review the #1 most profitable product for community banks; Commercial Mortgages. The table below shows the Net Spread for the Commercial Mortgage portfolio for the TKG PEER group. This table illustrates the impact of the increase in rates on the overall net spread of Commercial Mortgage portfolios. As normally happens, when rates rise banks do not increase rates on new loans at the same level as the increase in market rates. Loan spreads were impacted even more in 2022 due to the Fed increasing rates 125 to 150 basis points in some quarters. Banks provided commitment letters to Commercial Mortgage customers, but by the time the loan actually settled interest rates may have jumped 75 basis points thus reducing the actual spread of the loan.
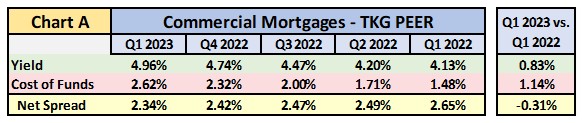
Chart B shows the actual spreads for TKG clients on new Commercial Mortgages during the last year. Even though spreads began to increase during the last three quarters, the spreads on new loans are still lower than the overall portfolio which includes loans originated prior to Q1 2022. Also note the lower balance of loans originated in Q1 2023 compared to Q4 2022.
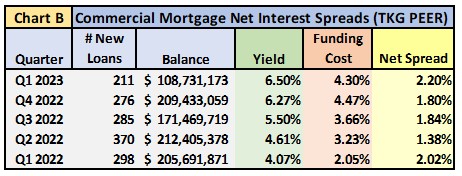
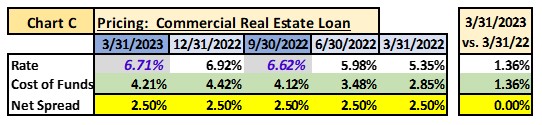
Chart C illustrates how high banks should have increased rates on new Commercial Mortgages during the last 5 quarters in order to maintain a 250 basis point spread.
 While the increase in the Fed Funds rate negatively impacted loan spreads, deposit product spreads experienced a significant increase. In a rising interest rate environment, the value of deposits increases since banks do not have the pressure to increase their rates at the same level as the Fed Funds rate. While this was true for most of 2022, banks have experienced a substantial increase in funding costs during the past few quarters.
For our reporting, we calculate a “credit for funds” (CFF) for deposits to provide interest income and a net deposit spread. The CFF is based on the average life of a bank’s deposit products. Since the average life of a core deposit is higher than a 1-year CD, it has a higher CFF and is thus more valuable. We use the FHLB Fixed-Rate Advance curve to calculate the CFF.
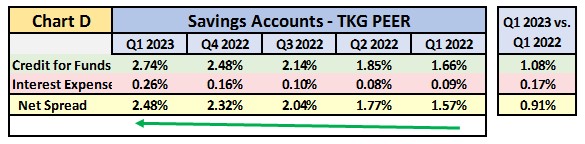
As noted in the chart below, the Savings product benefited from the increase in market interest rates. While their credit for funds grew 1.08% from Q1 2022 to Q1 2023, its interest expense only grew 0.17%. This improved the annualized profit on a Savings account from $52 to $176 during this period.
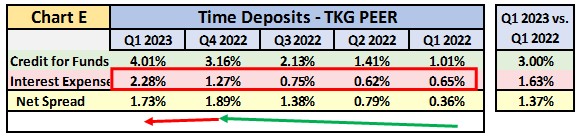
 TKG clients have used Time Deposits to provide additional funding during the last few quarters, as a result of the outflow of excess liquidity accumulated in core deposits during COVID and the lower funding cost they provide compared to FHLB borrowings. Spreads on Time Deposits grew significantly during 2022, since banks were offering time deposits at rates less than comparable FHLB borrowing rates. That all changed during Q1 2023 when banks substantially increased time deposit rates resulting in a decrease in time deposit portfolio spread.
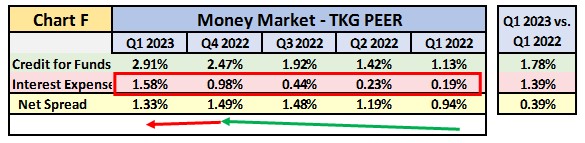
 Banks have also become more aggressive with Money Market rates. Below are the changes in the net spread of Money Market accounts from Q1 2022 through Q1 2023 (Chart F). Even when the Fed began to increase rates during the first half of 2022, banks were still flush with liquidity and did not need to increase rates to hold onto or attract deposits.
Once the outflows of deposits began in earnest during Q3 2022, institutions became more aggressive with their deposit rates. TKG’s PEER average Money Market rate grew from 0.23% in Q2 2022 to 1.58% in Q1 2023. This increase in rates decreased the profitability of the Money Market product from $1,657 per account in Q4 2022 to $1,230. This reduction in profitability was also impacted by the reduction in average balance from $170,000 to $157,000 during this period.
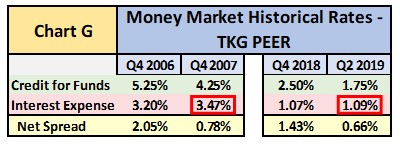
 The question we are most often asked is how high do we think rates will go? Based on our historical PEER data for Money Market accounts, interest rates paid on deposits have a long way to go. Chart G shows how interest paid on Money Market accounts peak one year after the Fed begins to lower rates. A review of the Fed’s target interest rates shows they may begin to lower rates during 2024, which based on past trends banks may not begin to lower money market rates until 2025! Also based on this data, Money Market rates will go much higher before they begin to be lowered.
 The outlook for banks to improve their net interest margins in 2023 does not look promising. The Fed’s plan to increase rates further combined with the current battle for deposits will make the remainder of 2023 difficult for banks to maintain their current net interest margins let alone improve them. TKG expects the spread on loans to recover as banks and customers become more accustomed to the higher rate environment, but funding costs will continue to increase well into 2024.
Our Performance Measurement service is designed to provide institutions with profitability information for their organizational profit centers and for the products they offer. Our clients also use data from these profitability systems to feed customer level data into their MCIF and CRM systems. Over the years we have provided this service to hundreds of institutions, so they can foster an accountability culture and improve their bottom line results. One of the most valuable components of our service is compiling PEER information our clients can use to measure against their own performance.
Are you interested in learning more about how your institution can utilize performance measurement information to make more informed decisions to enhance the profitability of your organization and products? If so, please contact me at gwagner@kafafianstg.wpenginepowered.com or give me a call at 973.299.0300 ext. 114.
Click here to view printer-friendly version.
This newsletter relates to our Performance Measurement service, click here for more information.
To receive our newsletter and other TKG content, subscribe at the bottom of this page.